Published: Aug 20, 2021 by Dev-hwon
이 내용은 고려대학교 강필성 교수님의 Business Analytics 수업을 보고 정리한 것입니다.
아래 이미지 클릭 시 강의 영상 Youtube URL로 넘어갑니다.
Anomaly Detection Overview
1. Anomaly
Novelty와 Outlier와 혼용해서 사용되기도 함. Outlier는 단변량에서 극단의 값을 갖는 느낌, Anomaly와 Novelty는 다변량에서의 극단 값으로 볼 수 있는데, Anomaly는 부정, Novelty는 긍정의 느낌
일반적인 데이터와는 다른 매커니즘에 의해서 발생된 데이터 (Hawkins, 1980)
객체들의 발생 빈도가 굉장히 낮은 객체 (Harmeling et al., 2006)
- Outlier와 noise의 차이점
- noise는 데이터 수집 관점에서 자연적으로 발생하는 변동성 (random error or variance)
- noise가 반드시 제거되어야 하는 것은 아니다.
- outlier는 일반적인 데이터 생성 매커니즘을 위배해서 만들어진 데이터이기 때문에 반드시 찾아야하며, 흥미로운 데이터이다.
2. Classification vs. Anomaly Detection
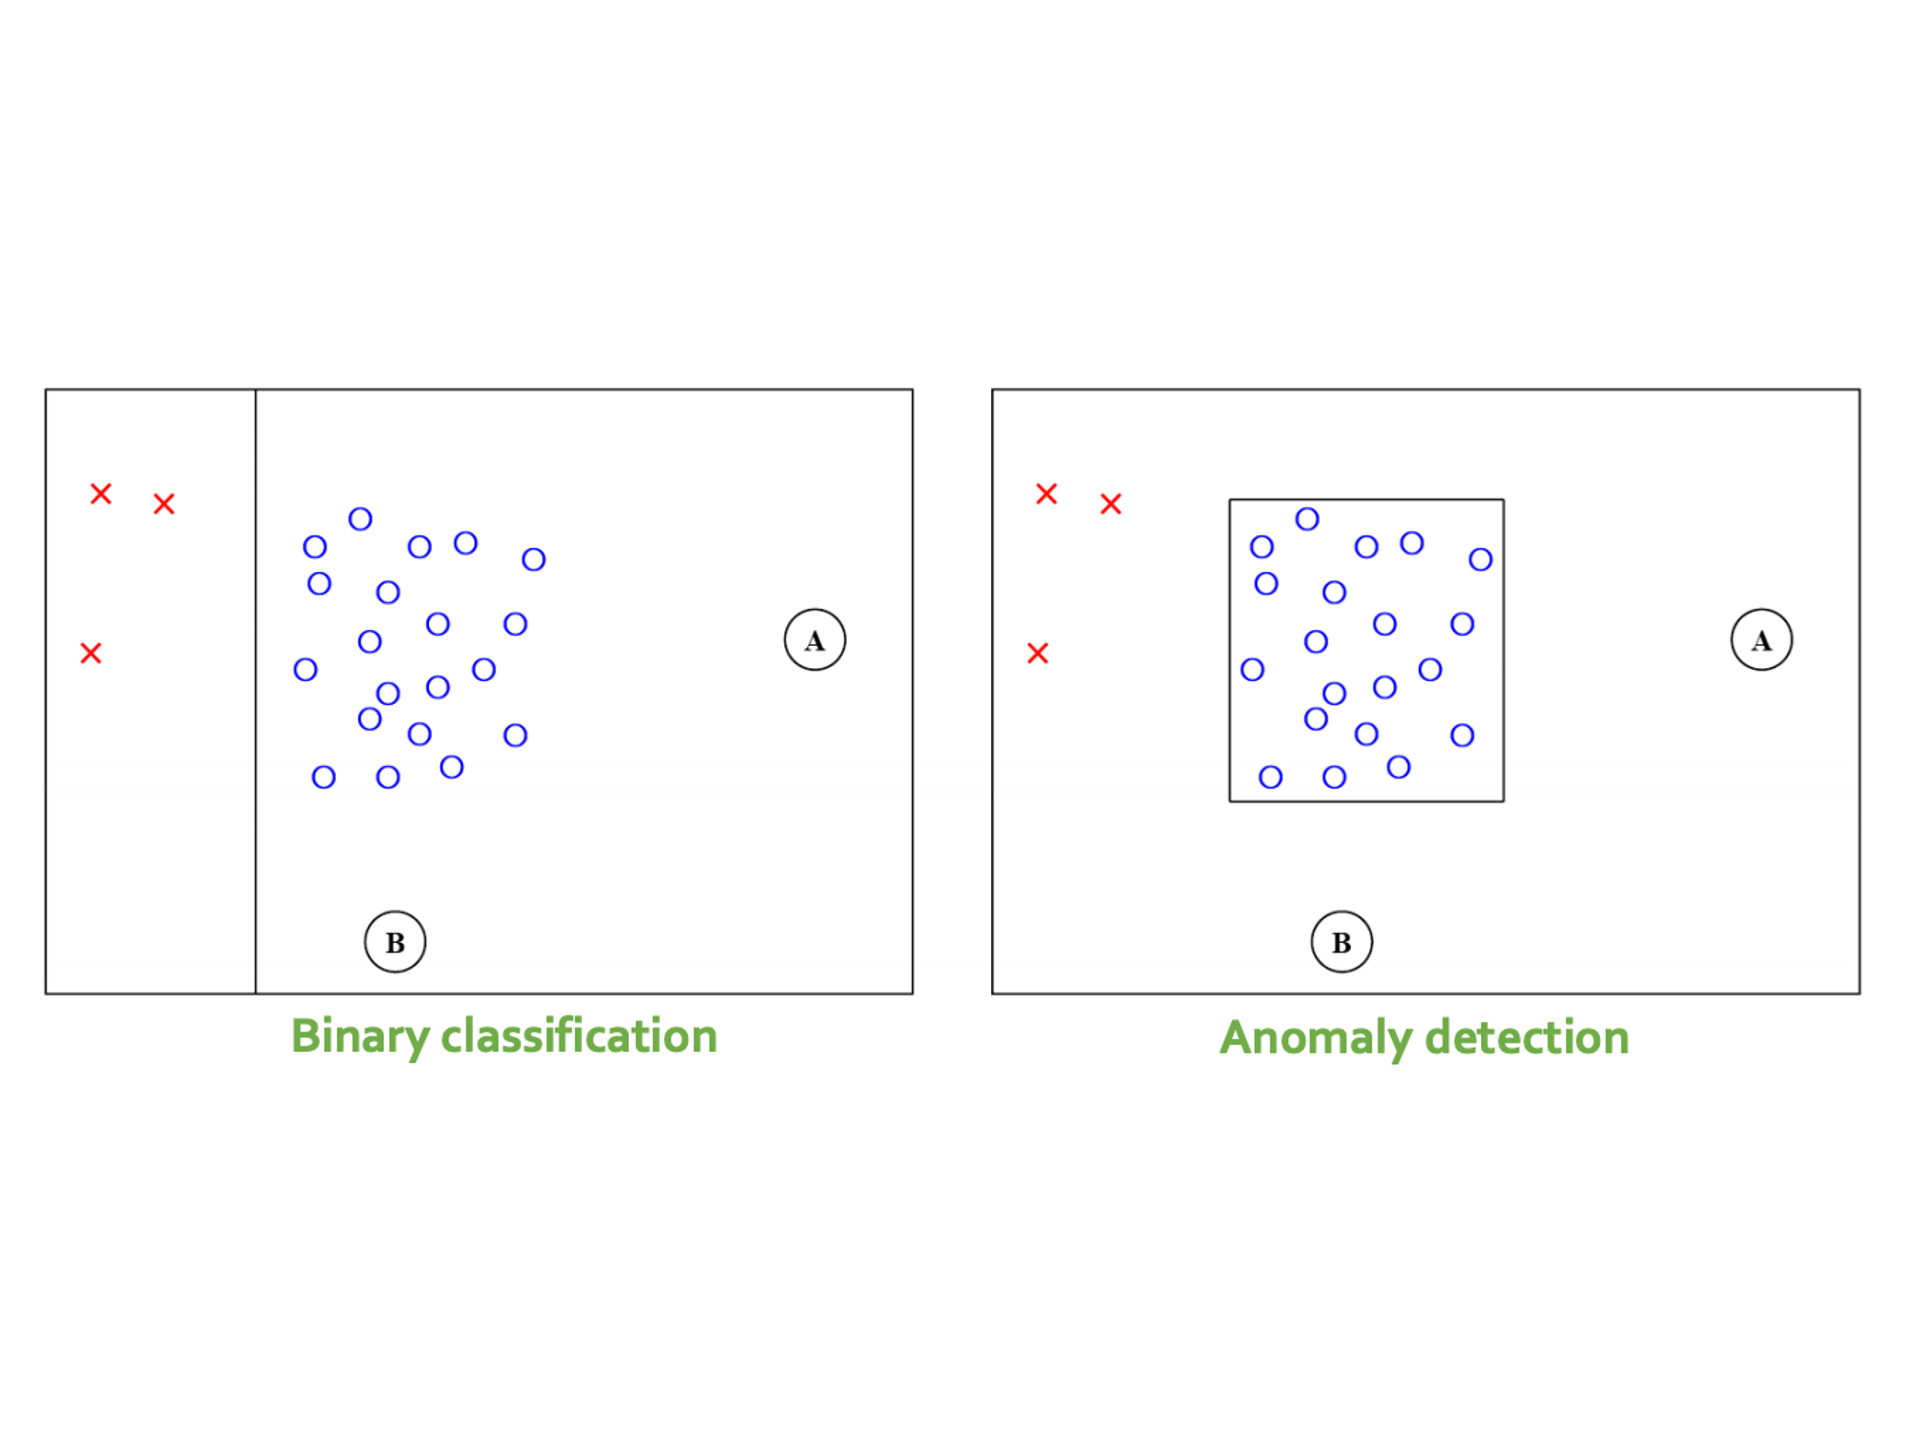
Anomaly detection의 실질적인 목적은 supervised learning이지만, 실질적으로 수행하는 방식은 unsupervised 방식이다.

classification은 반드시 주어진 범주중에 하나로 분류되야 하지만, anomaly detection은 정상의 영역의 boundary를 정해놓고 그 안에 들지 않으면 anomaly로 분류
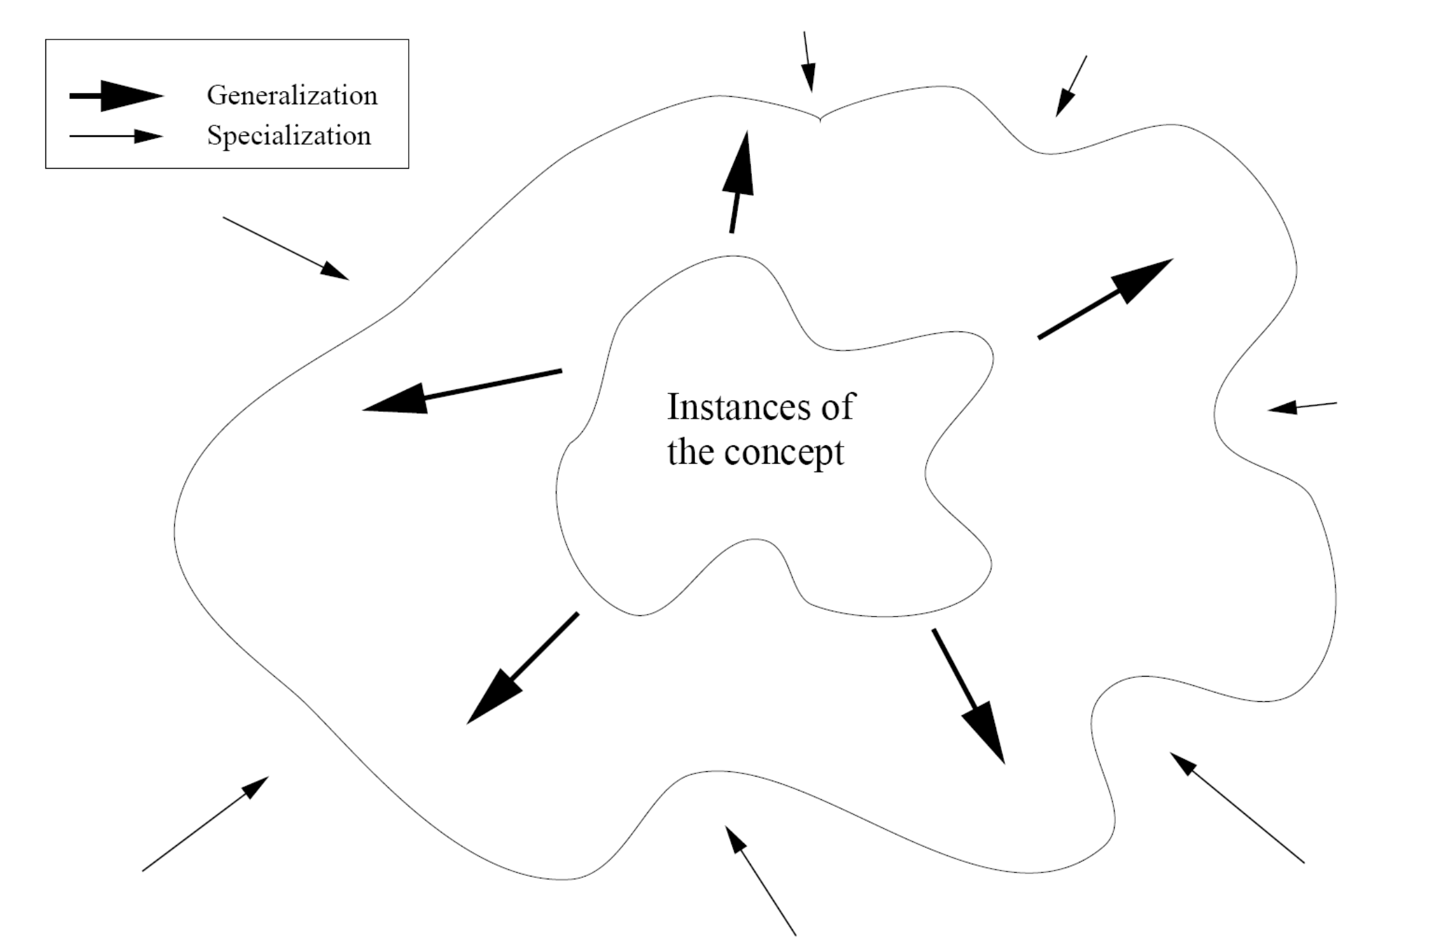
3. Generalization vs. Specialization
Generalization과 Specialization 사이에는 trade-off
4. Assumption
- normal 데이터가 abnormal 데이터보다 많아야 한다.
- 학습 방법
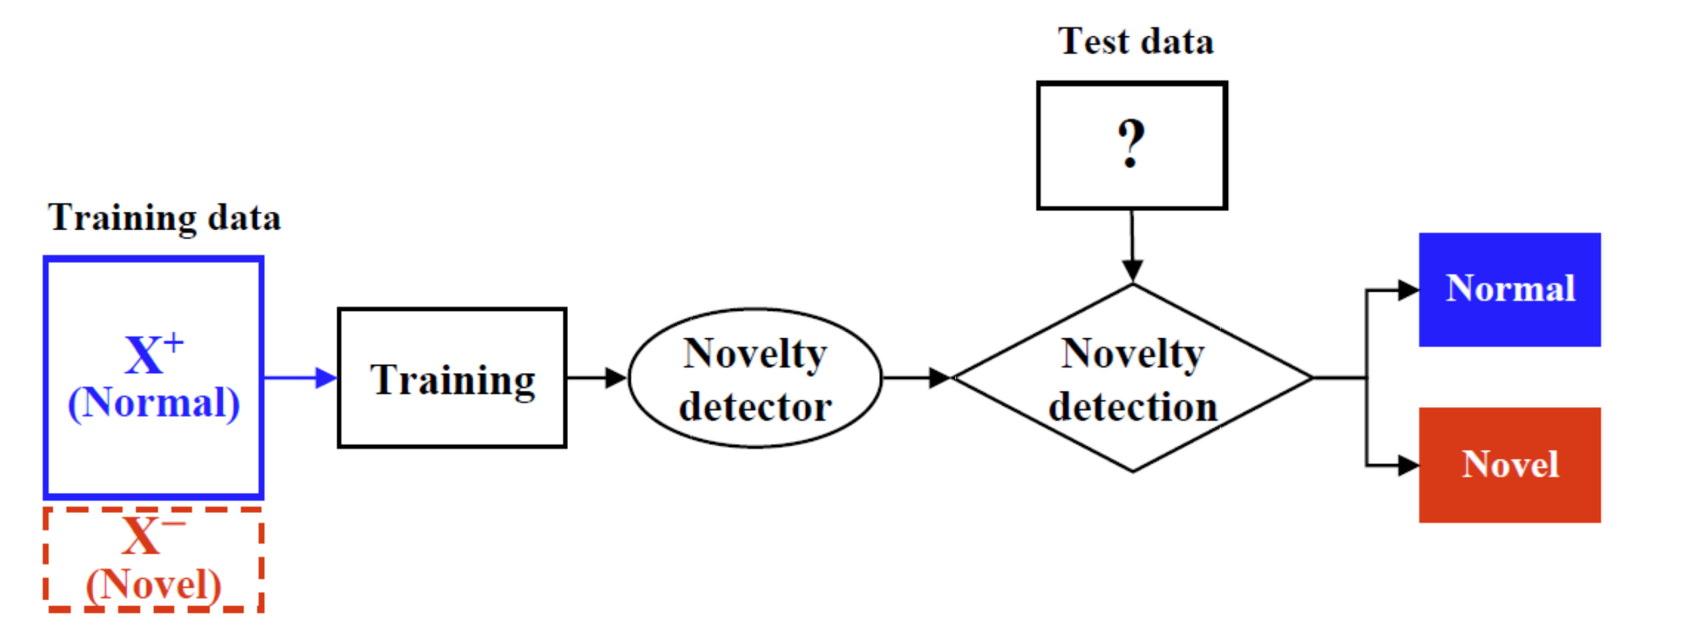
normal인 데이터만을 사용해서 모델 학습
5. Type of Abnormal Data (Outlier)
- Global outlier
- Contextual outlier (local outlier)
- Collective outlier (집단)
6. Challenges
- abnormal 데이터가 적은 상태에서 normal 데이터만을 가지고 학습을 하기 때문에 normal 데이터와 outlier를 적절히 모델링하는 것이 어려울 수 있다.
- 숫자가 적은 것도 있지만 영역의 boundary가 정확하게 정해지지 않기 때문(gray area)
- 우리가 풀고자 하는 application의 domain이 어디냐에 따라서 outlier의 정의, boundary가 domain에 종속적인 상황이 발생할 수 있다.
- 결과물에 대해서 이해가 가능해야한다.
7. Performance Measures
- Confusion matrix for novelty detection

- Performance measures when the cut-off (threshold) is set

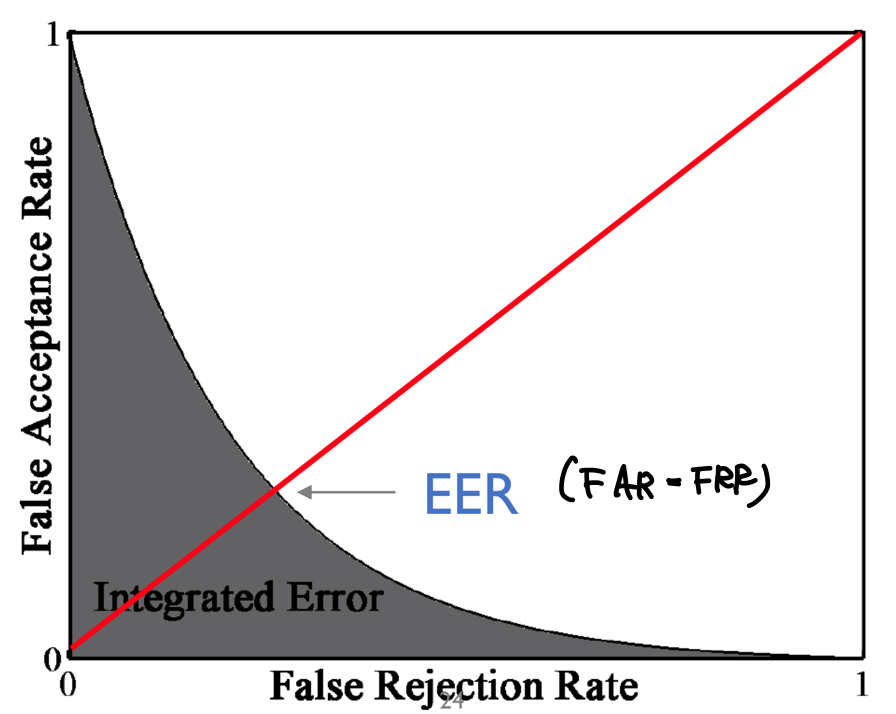
- Equal error rate (EER) : Error rate where the FAR and FRR are the same (낮을수록 좋다)
- Integrated Error (IE) : the area under the FRR-FAR curve (낮을수록 좋다)
